plot analysis
Math Geek Meets Novelist
No one’s shocked by the declaration that I’m a math geek who happens to write, right? Sometimes the math-geekiness informs my writing with character quirks or the way I apply logic. These are relatively small ways, where creativity and command of the language still play a larger role.
Once in a while, though, the geek takes over, and graphs ensue.
Really, this makes sense. The main reason graphs exist is to give us an instant visual of the big picture. Since a novel is hundreds of manuscript pages, it’s pretty difficult to look at it all at once as a whole.
What kinds of graphs? I’ll share a couple. (You can click them and get a better look.)
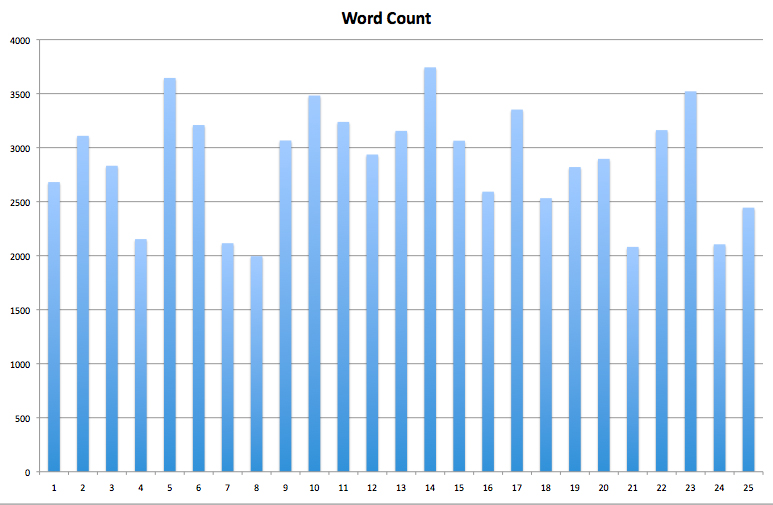
The first is a bar graph I made early on in my writing life to see how much my chapter lengths were varying. (Yes, this was also a case of my number-OCD coming out to play.) Nothing too fancy, just a simple graph in Excel.
I haven’t done one of these for my more recent manuscripts, but it gave me some thoughts about overall structure when I was first starting. Interesting note: the manuscript graphed here had twenty-five chapters at the time, but I eventually realized breaking some of them up worked better.
The second is one I just did for the first time this week as an experiment. I was curious how different plot “threads” or themes were distributed throughout the novel. Had I dropped a thread in and then neglected it for too long before it came up again? Were the key themes getting the amount of attention I feel they deserve?
So I listed three key threads, two secondary (sort of) ones, and a trait of the MC I wanted to make sure had been sprinkled consistently through the story. Then I started reading and noting the location where each item pops up or is addressed (shown as a percentage, i.e., 25% of the way through the novel). I made the graph using a middle school statistics program called Tinkerplots (yay for being a math teacher!), though something similar could be made using Excel … I think it’d just be a little more complicated.
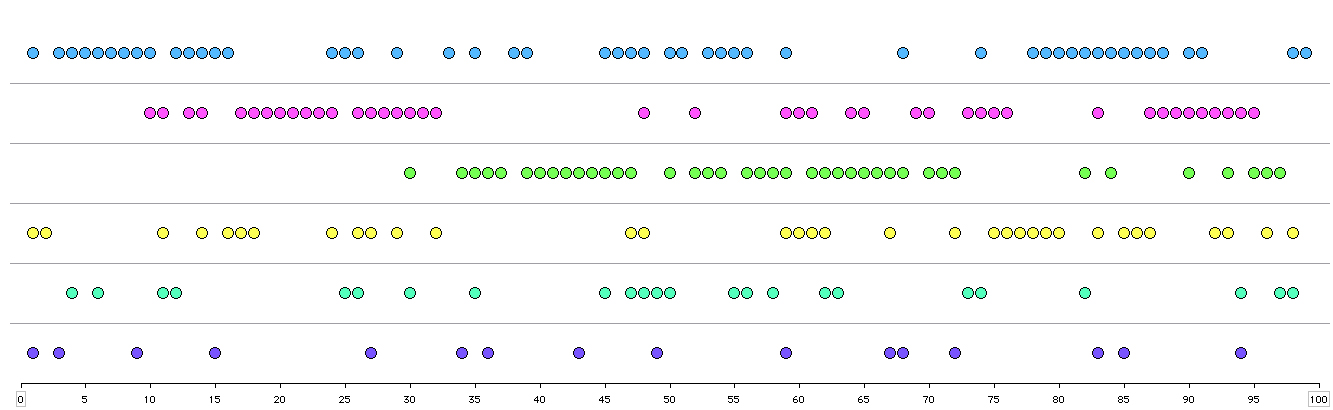
I’m pretty pleased with the results. The three main threads obviously have sections where they each take precedence, and the “sprinkling in” looks pretty much how I want it.
Yes, I’m a geek.
Have you ever analyzed your writing in a “non-writing” way? Have you applied your day-job skills to something unexpected?